
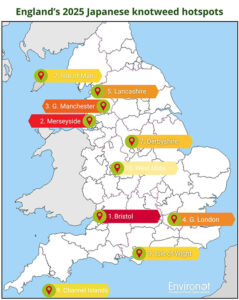
An online heatmap from invasive plant specialist Environet shows that Bristol holds the dubious title of Japanese knotweed capital of England.
Data from the online tracker has revealed the south-west city has 33.91 incidences of the dreaded weed per square mile, followed by Merseyside with 11.87 and Greater London with 7.74.
With over 100,000 sightings logged, Evironet is urging homeowners to check the map for risk in their area as the invasive plant hits peak growing season.
Environet director Emily Grant explained:
“At this time of year, knotweed is in full growth mode and easy to spot with its bright green heart-shaped leaves which grow in a zigzag pattern up the stems. Mature plants flower around August, when they produce clusters of tiny white blooms.”
Presence of the weed can reduce a property’s value by approximately 5%, Environet warns, with a 2023 DEFRA report calculating the cost to the UK economy at nearly £250 million a year.
Grant added:
“By mapping verified sightings, we’re helping people understand the level of risk in their local area and encouraging early identification and treatment.
“Public engagement is key in the fight against knotweed, and by reporting new sightings homeowners can play an important role in controlling this invasive plant and protecting property values.”
Environet says its online map offers the most comprehensive online record of Japanese knotweed in the country. Members of the public can enter their postcode to discover the number of sightings nearby, with hotspots highlighted in yellow, orange or in the worst cases red – helping them understand the level of risk posed to their home or one they wish to buy.
The heatmap can also be populated with sightings by adding a photograph to be verified by experts.
Accounting for the different sizes of each county or unitary authority, Environet has calculated the number of known Japanese knotweed infestations per square mile to identify the worst affected locations this year.
| Rank | County | Total Incidences | Incidences / mi² |
| 1 | Bristol | 1,440 | 33.91 |
| 2 | Merseyside | 2,963 | 11.87 |
| 3 | Greater London | 4,687 | 7.74 |
| 4 | Lancashire | 8,612 | 7.25 |
| 5 | Greater Manchester | 3,558 | 7.22 |
| 6 | Isle of Man | 982 | 4.45 |
| 7 | Channel Islands | 301 | 3.94 |
| 8 | Isle of Wight | 554 | 3.77 |
| 9 | Derbyshire | 3,427 | 3.38 |
| 10 | Nottinghamshire | 2,091 | 2.51 |
| 11 | West Midlands | 811 | 2.5 |
| 12 | Surrey | 1,050 | 1.64 |
| 13 | Tyne & Wear | 292 | 1.4 |
| 14 | Hertfordshire | 867 | 1.37 |
| 15 | Cheshire | 1,218 | 1.35 |
| 16 | Worcestershire | 723 | 1.08 |
| 17 | Cornwall | 1,254 | 0.91 |
| 18 | East Sussex | 616 | 0.89 |
| 19 | Shropshire | 1,193 | 0.89 |
| 20 | Bedfordshire | 415 | 0.87 |
Japanese knotweed first arrived in UK in the Victorian times in a box of plant specimens delivered to Kew Gardens and was quickly adopted by gardeners and horticulturalists, who were unaware of its invasive nature. Since then it has spread widely, with an average of 1.1 occurrences in every square mile of England and 3.9 in Wales.
Check the heatmap at www.environetuk.com/exposed-japanese-knotweed-heat-map