Bristol remains the UK Japanese knotweed hotspot for the second year, according to new figures released by Environet.
The specialist invasive plant remover based its analysis on more than 100,000 verified sightings from its live online tracker, along with Environet’s own enquiries and public sources.
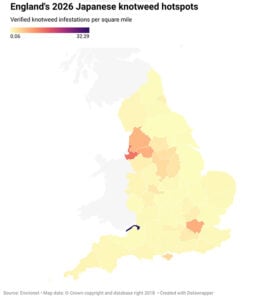
The analysis found exceptionally high concentration of infestations in Bristol, with 32.29 incidences per square mile – more than twice the density of second-placed Merseyside. Greater London is third this year, ahead of Greater Manchester and Lancashire.
Knotweed is now present in every county of the UK, with an average of 1.1 occurrences in every square mile of England and 3.9 in Wales, impacting an estimated 1.58 million homes across the country.
Research conducted by Environet in partnership with Censuswide in January indicates that 7% of the UK’s homes – more than 1.58 million properties – are impacted by the invasive plant.
Property values are typically reduced by around 5%, equivalent to £13,500 per home.
According to global agriculture non-profit CABI, Japanese knotweed is the UK’s second most costly invasive non-native species, responsible for an estimated £246.5 million in annual economic costs.
Environet director Emily Grant said: “Japanese knotweed is now firmly established across England, with former industrial and port areas recording by far the highest concentrations.
“While there are significant hotspots in the south such as Bristol and London, the north of England accounts for more than half of the top 20 hotspots by infestation density.
“At this time of year, an established knotweed plant can be identified quite easily by its hard bamboo-like canes and distinctive bright green shield-shaped leaves which grow in a zig-zag pattern along the stem.
“The earlier it’s spotted, the easier and cheaper it is to deal with, and with a professional treatment plan in place homeowners have a much better chance of preserving the value of their property.”
Rankings by region. Source: Environet
| Rank | County | Total Incidences | Incidences / mi² |
| 1 | Bristol | 1,324 | 32.29 |
| 2 | Merseyside | 3,393 | 13.45 |
| 3 | Greater London | 4,704 | 7.67 |
| 4 | Greater Manchester | 3,688 | 7.49 |
| 5 | Lancashire | 8,795 | 7.00 |
| 6 | Isle of Man | 1,002 | 4.53 |
| 7 | Channel Islands | 301 | 3.94 |
| 8 | Isle of Wight | 554 | 3.78 |
| 9 | Derbyshire | 3,496 | 3.44 |
| 10 | South Yorkshire | 1,701 | 2.84 |
| 11 | Bath and North East Somerset | 365 | 2.69 |
| 12 | Nottinghamshire | 2,084 | 2.50 |
| 13 | West Midlands | 693 | 2.23 |
| 14 | West Yorkshire | 1,198 | 1.91 |
| 15 | Surrey | 1,094 | 1.70 |
| 16 | Hertfordshire | 850 | 1.34 |
| 17 | Cheshire | 1,207 | 1.31 |
| 18 | Tyne and Wear | 272 | 1.30 |
| 19 | Berkshire | 547 | 1.12 |
| 20 | Worcestershire | 738 | 1.10 |