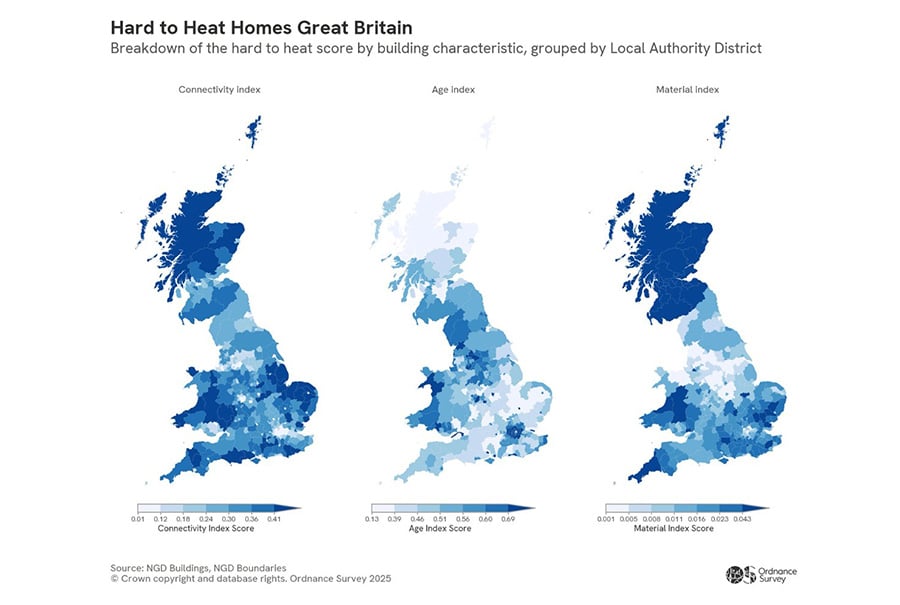
An analysis of over 23 million homes across Great Britain using the Ordnance Survey National Geographic Database (OS NGD) has identified the characteristics of homes vulnerable to low temperatures.
By applying OS NGD building attributes to create a heat index, areas where homes are most at risk of heat loss can be mapped to help identify locations that would benefit from retrofitting, insulation upgrades and other energy-efficiency improvements, OS said.
The OS NGD was used to identify trends and compare physical characteristics of homes using a heat index to assess how easy they are to heat. Factors included within the assessment included whether the properties have shared walls, the period of construction, and the construction material.
A score was given for each of the three building characteristics, with lower scores indicating easy-to-heat properties. The scores were then grouped and averaged by each Local Authority District.
The analysis revealed that Local Authority Districts in northern Scotland and Wales have the highest average heat-loss scores, with Na h-Eileanan an Iar in the Western Isles achieving the highest average score. The lowest score, and therefore the highest heat retention, was found in Stevenage in Hertfordshire.
Geographical location and building materials play a major role in the heat factor, OS said. In Cornwall, the predominance of traditional graphite-built homes makes insulation more challenging, while the poorly performing homes in the Scottish Highlands are made more susceptible due to the higher proportion of old stone houses.
“While details about granite and older stone construction are based on general characteristics and not derived from OS data, they help illustrate why certain areas face greater heat‑retention challenges,” the organisation explained.
Homes in London’s Tower Hamlets ranked among the easiest to heat, which OS says is likely to be due to the high proportion of flats (21% of the total housing stock) with shared walls and the lowest percentage of buildings built before 1960 (37%).
Harrow, by contrast, scored poorly due to the high number of standalone properties and 84% of its homes built before 1960. “Homes built post-1960 generally have better insulation, cavity walls and double glazing, reducing heating bills and preventing damp and condensation,” the OS explained.
“Building regulations introduced in the mid-1960s began requiring insulation, and standards have tightened significantly since then. Homes built after this period tend to feel warmer and less damp, meaning they require less energy to heat.”
Unsurprisingly, new towns such as Milton Keynes, where the majority of homes (85%) were built after 1960, are easier to heat.
“Understanding which homes are hardest to heat is critical for improving energy efficiency,” said Isabelle Chatel de Brancion, land and property lead at Ordnance Survey.
“Ordnance Survey data provides detailed insights into building age, construction materials, and location, enabling us to model heat-loss risk at scale.This data-driven approach helps pinpoint areas most vulnerable to heat loss and identify where energy-efficiency improvements would have the greatest impact.
“Beyond highlighting national patterns, OS data can also shed light on viable solutions such as identifying rooftops suitable for solar panels, informing town planning, and helping utility companies optimise renewable energy plans. These insights could support local authorities and homeowners in making informed decisions to keep homes warmer this winter and reduce costs.”
Understanding which homes are hardest to heat can also help target energy-efficiency improvements and support households most vulnerable during cold spells. Augmenting the data with Index of Multiple Deprivation statistics related to income deprivation, council tax bands and other population characteristics can further target resources where they are most needed, OS said.